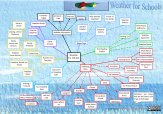
Weather Data from Tamworth, Staffordshire, UK
 The weather data in the files on this page is recorded at the Weather for Schools site about 7km south east of Tamworth,
Staffordshire, UK. The site is in the garden of a house on a large
housing estate. The site is sloping, and has walls, fences and house creating a boundary. We make
no claim
for
accuracy,
as
the data
is collected as a hobby. However every attempt is made to follow correct procedures where possible within the confines of the location. The data is placed on this website for other
people’s interest, education and amusement. Despite any limitations we do hope that the data
provided is still useful. See more about setting up a Stevenson screen on the Setting up your Weather Station page.
The weather data in the files on this page is recorded at the Weather for Schools site about 7km south east of Tamworth,
Staffordshire, UK. The site is in the garden of a house on a large
housing estate. The site is sloping, and has walls, fences and house creating a boundary. We make
no claim
for
accuracy,
as
the data
is collected as a hobby. However every attempt is made to follow correct procedures where possible within the confines of the location. The data is placed on this website for other
people’s interest, education and amusement. Despite any limitations we do hope that the data
provided is still useful. See more about setting up a Stevenson screen on the Setting up your Weather Station page.
The data is collected each day at 9.00 GMT. Some data is also collected remotely.
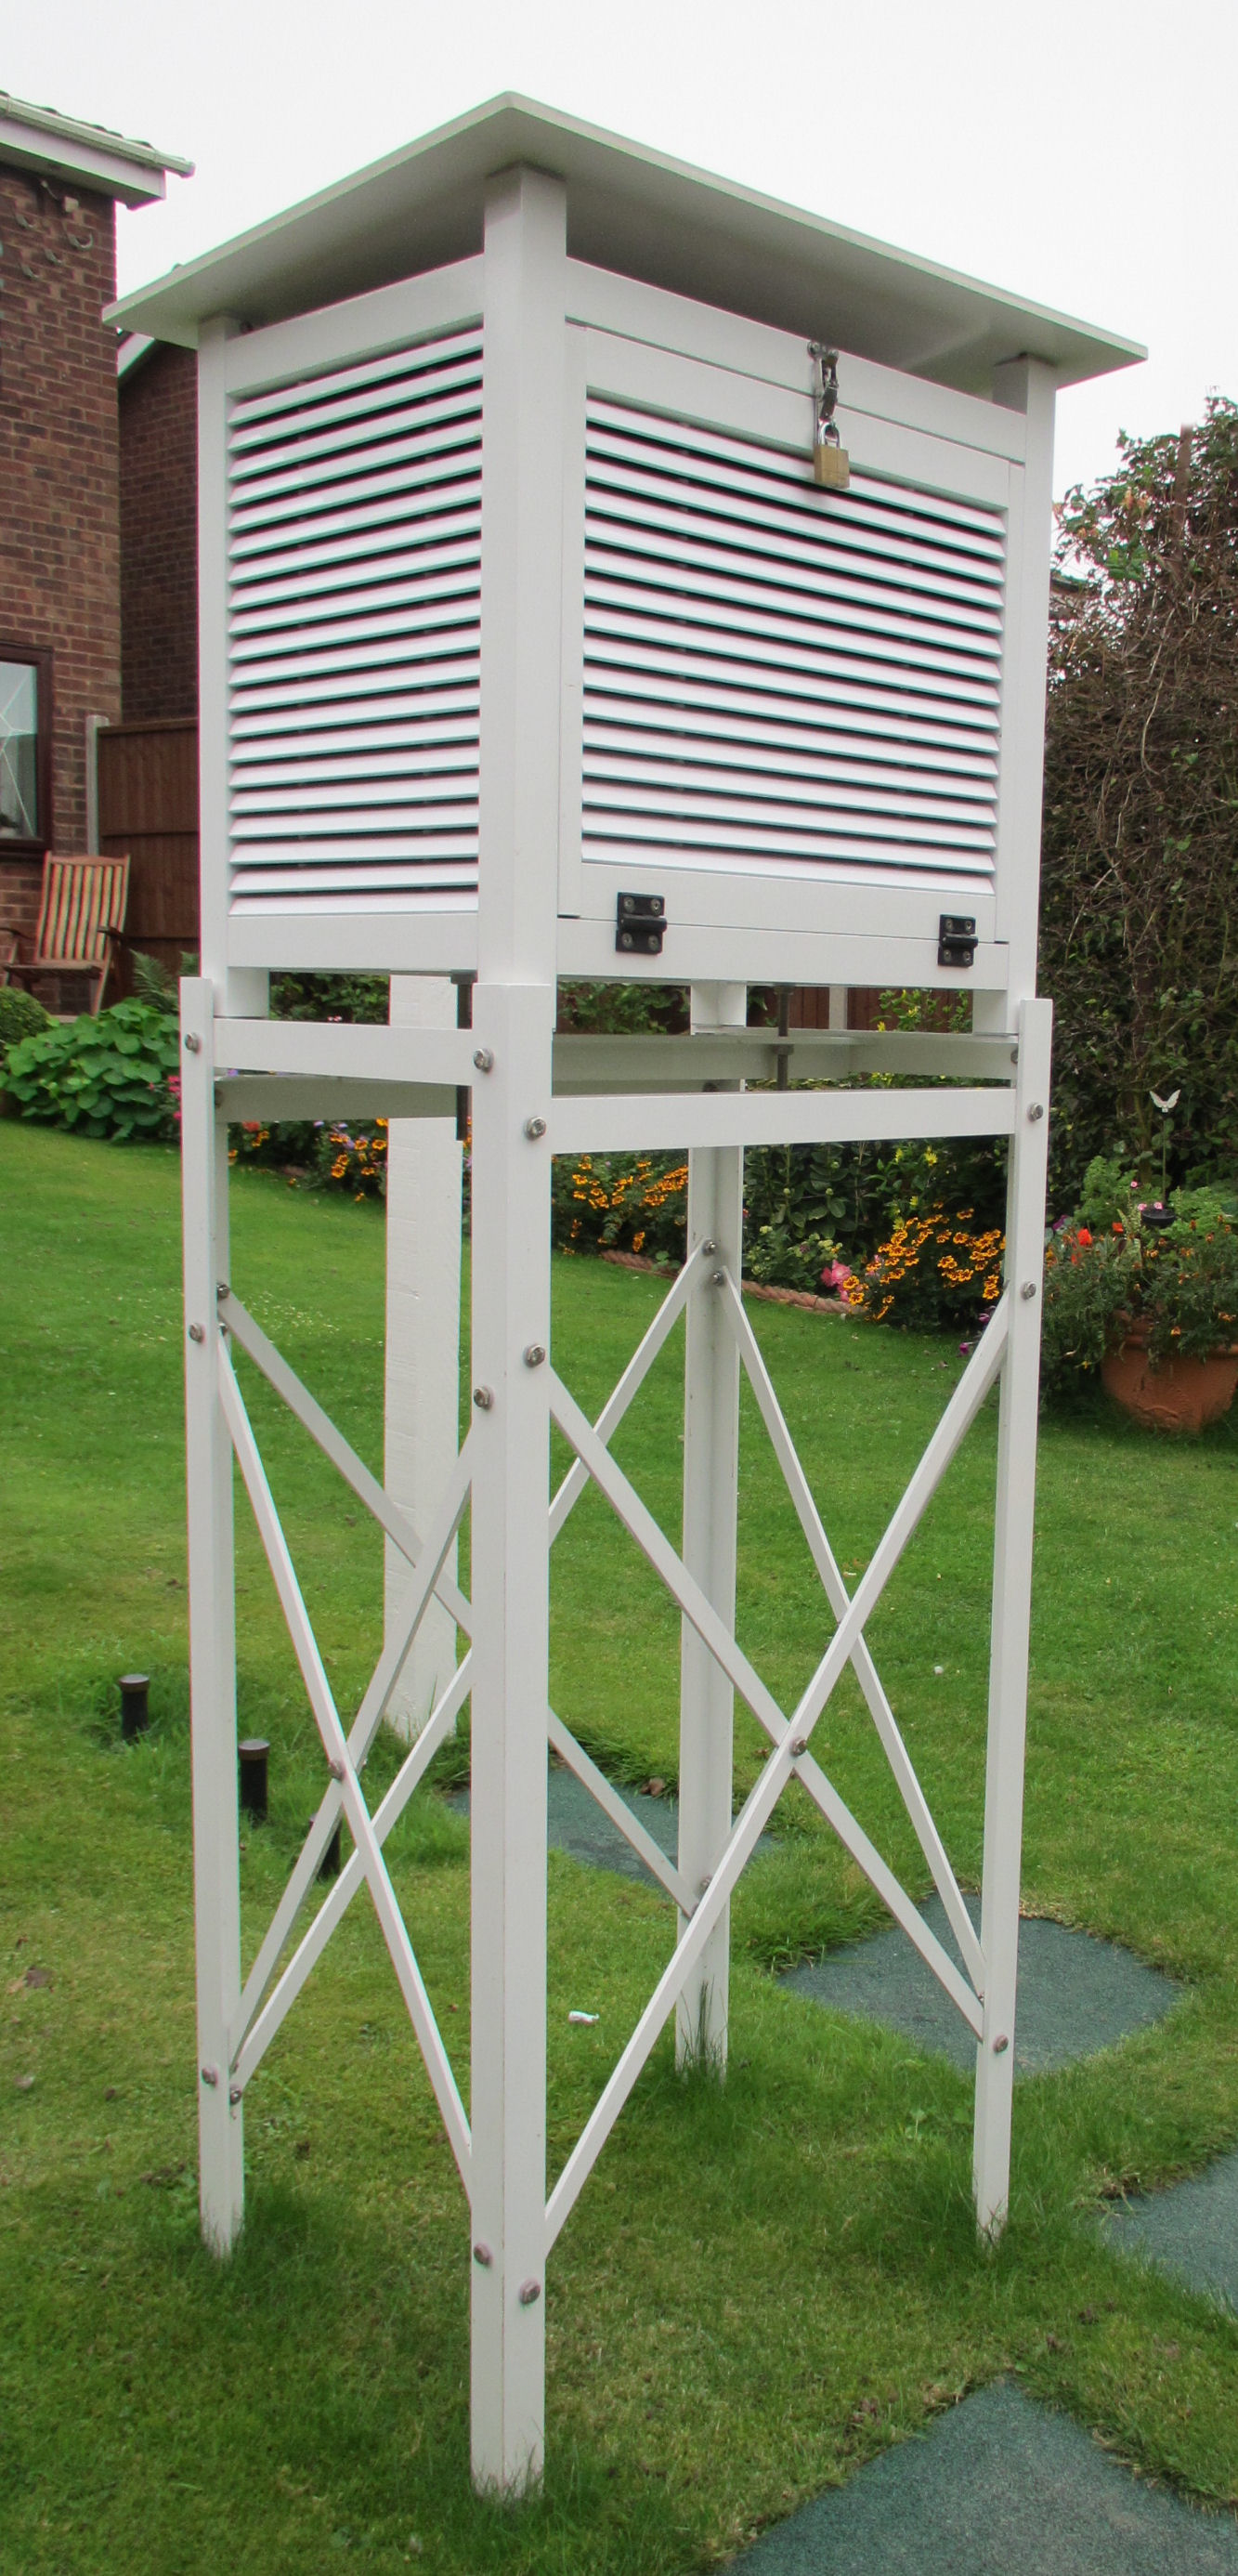
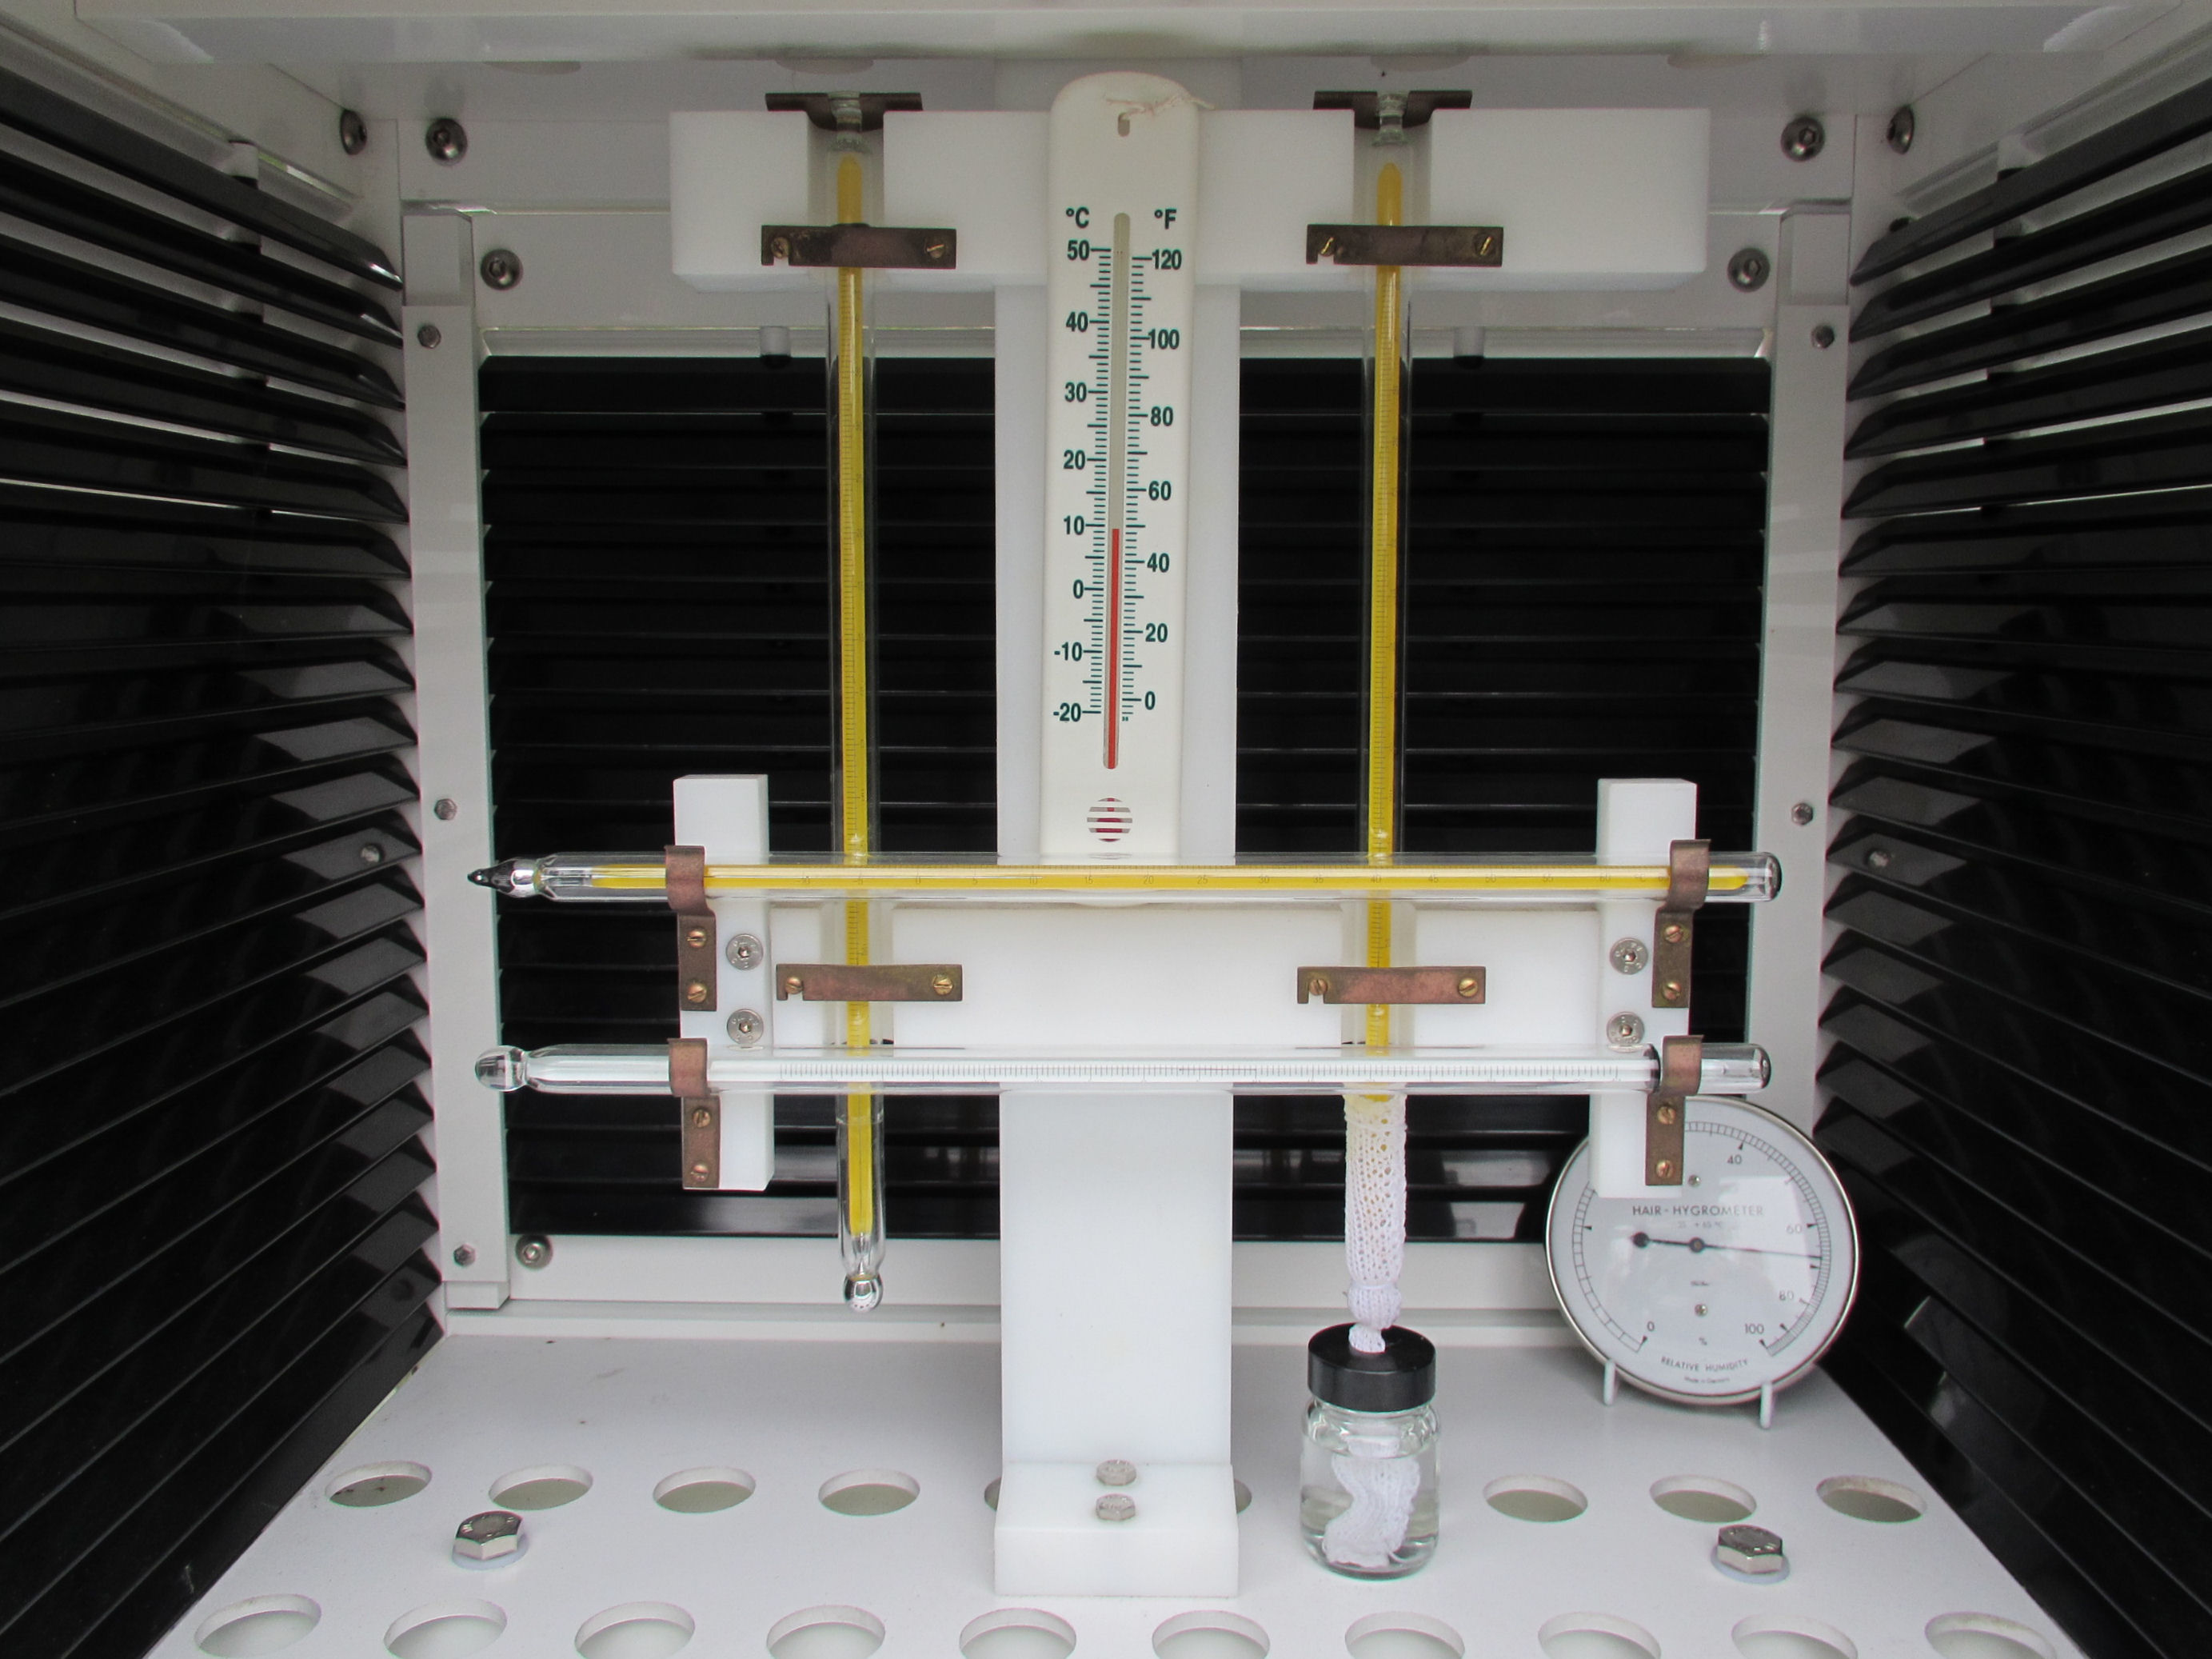
The Stevenson screen on the left contains some of the weather instruments. It is a modern aluminium Metspec screen. Follow the link to read more about it. The inside can be seen below.
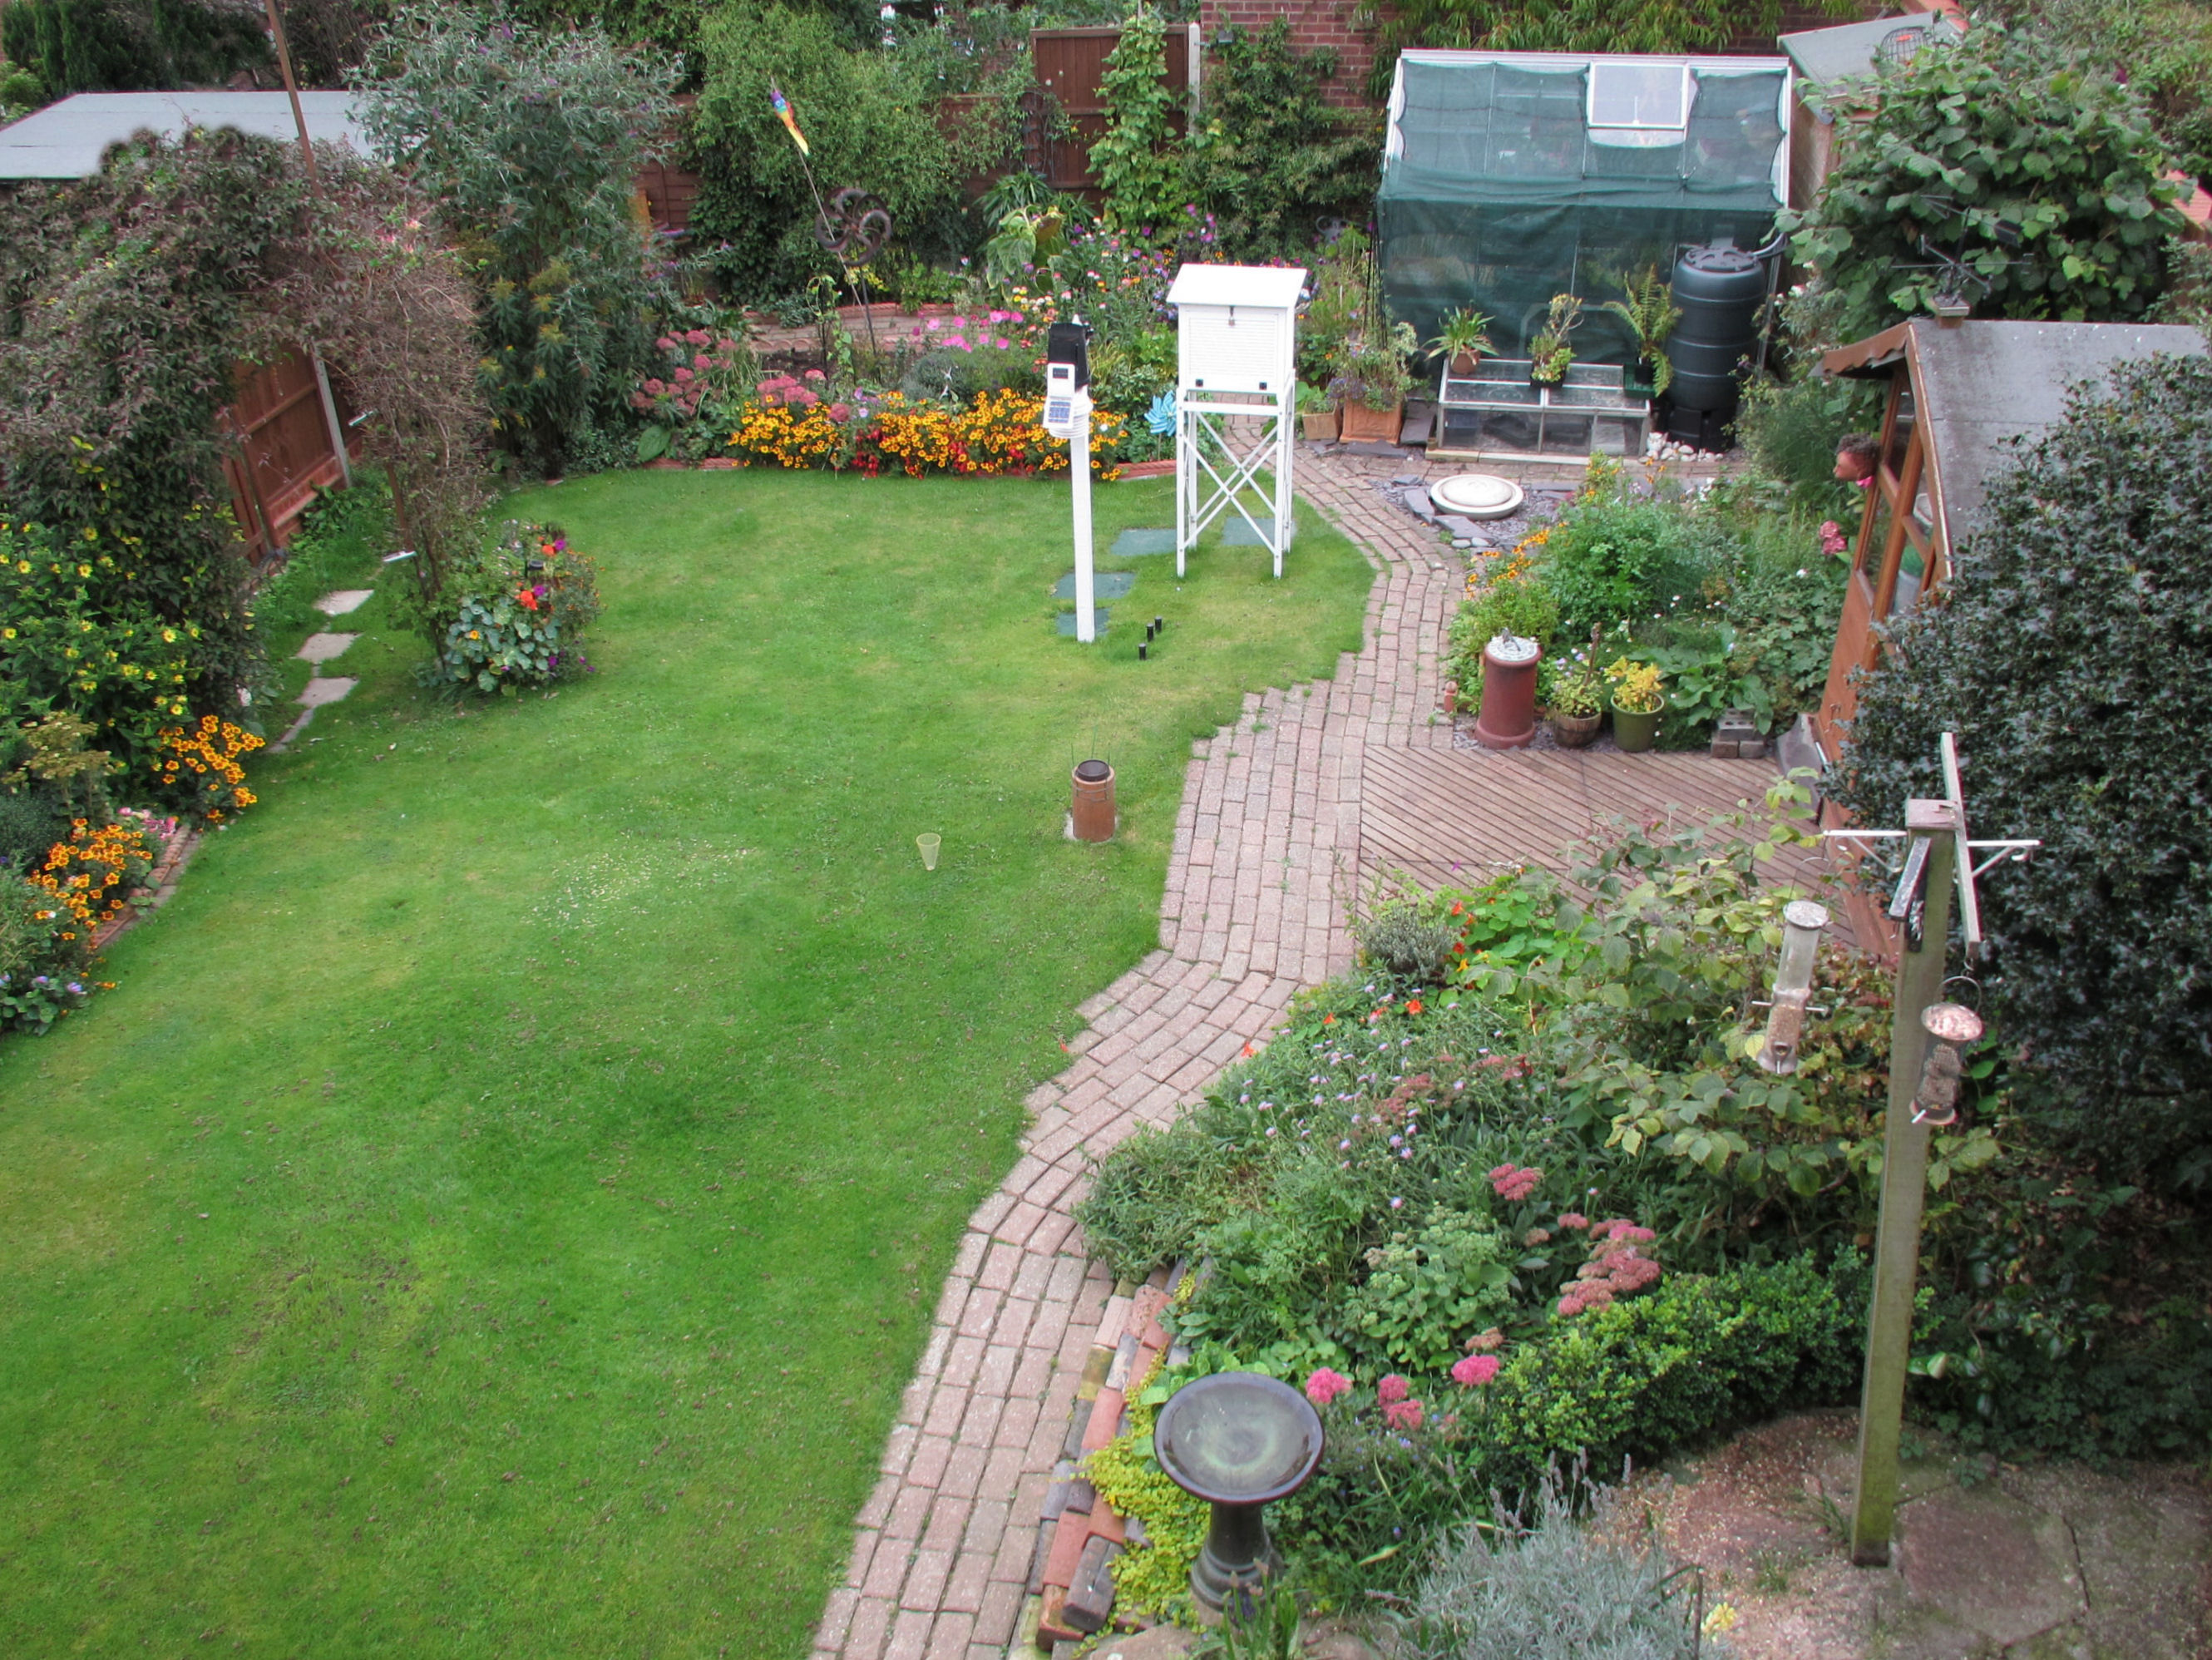
This picture of the site shows how every effort has been made to get the most out of the small garden. The rain gauge is as far from tall obstacles as possible. The camera was pointing north, so the door to the Stevenson screen is on the far side of the weather box. The area around the instruments is kept to grass as much as possible. The stepping mats are made of non-slip rubber, which seems to be safer in frosty conditions. It also retains less heat than concrete. The AWS (Automated Weather Station) is situated near the Stevenson screen. It has a wireless connection to its consol and a computer .
Inside the Metspec Stevenson Screen
|
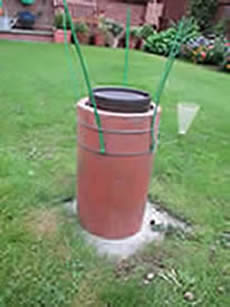
Copper Rain Gauge
|
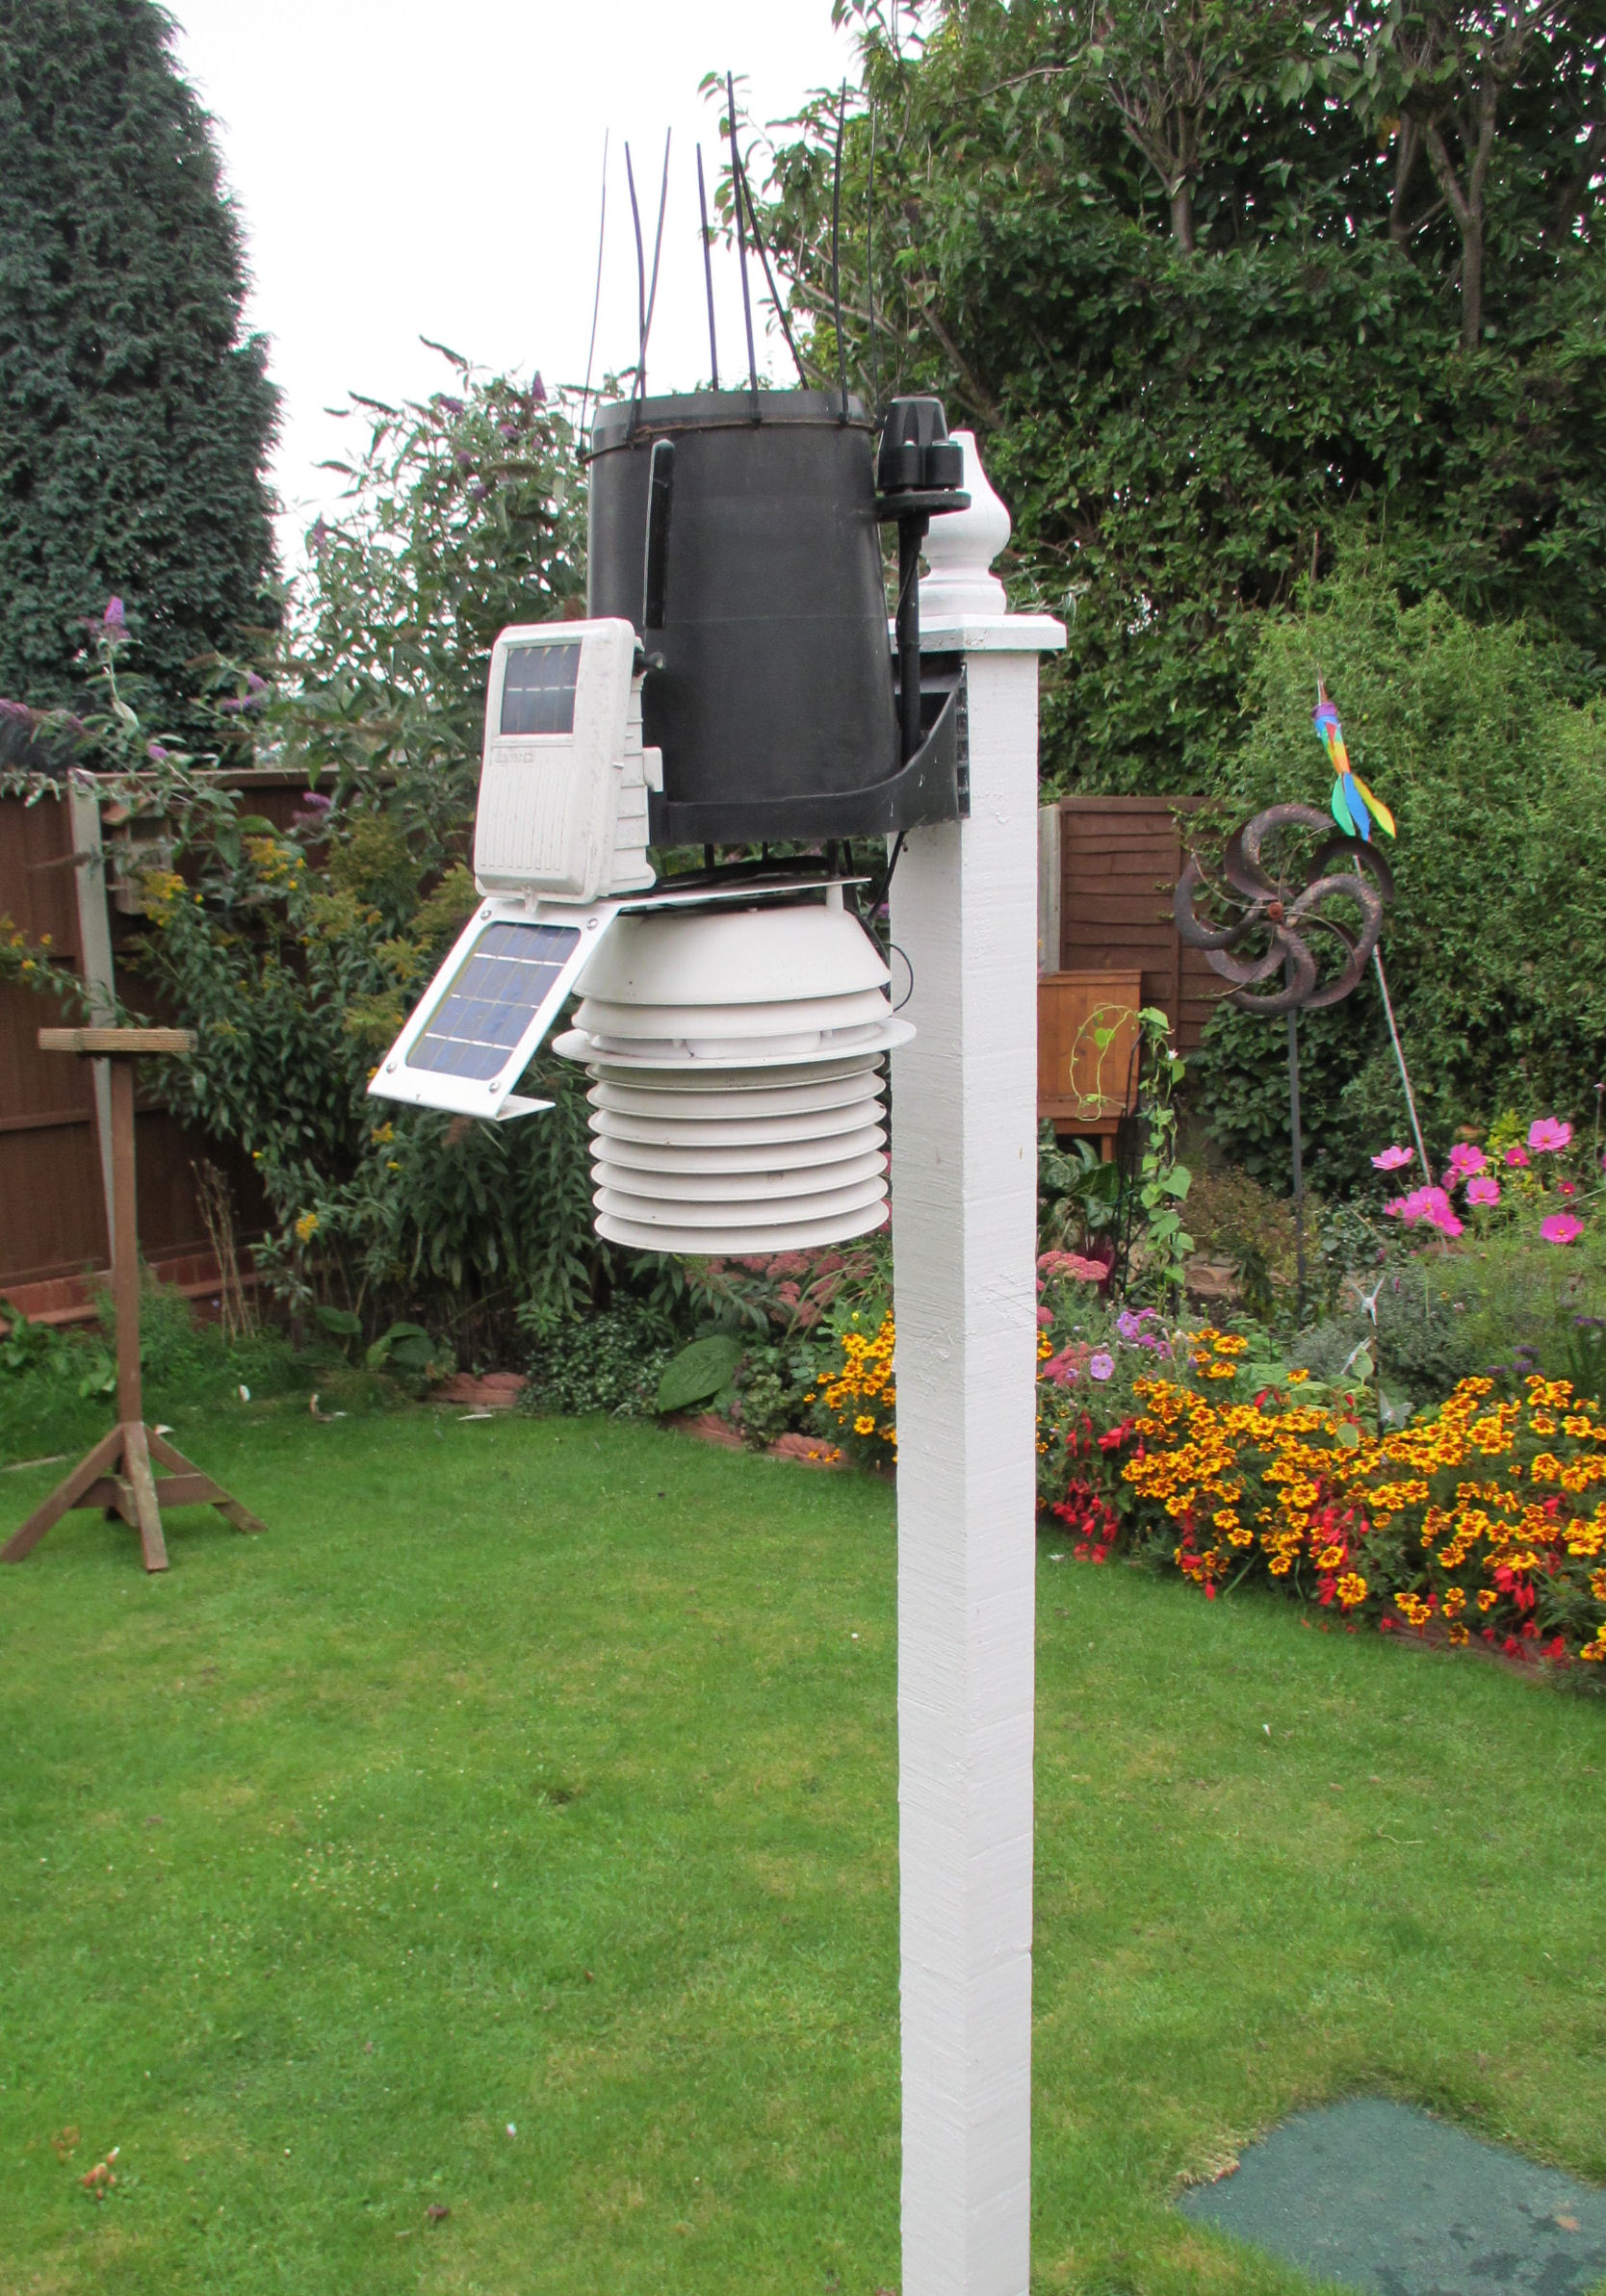
Davis Vantage Pro 2
|
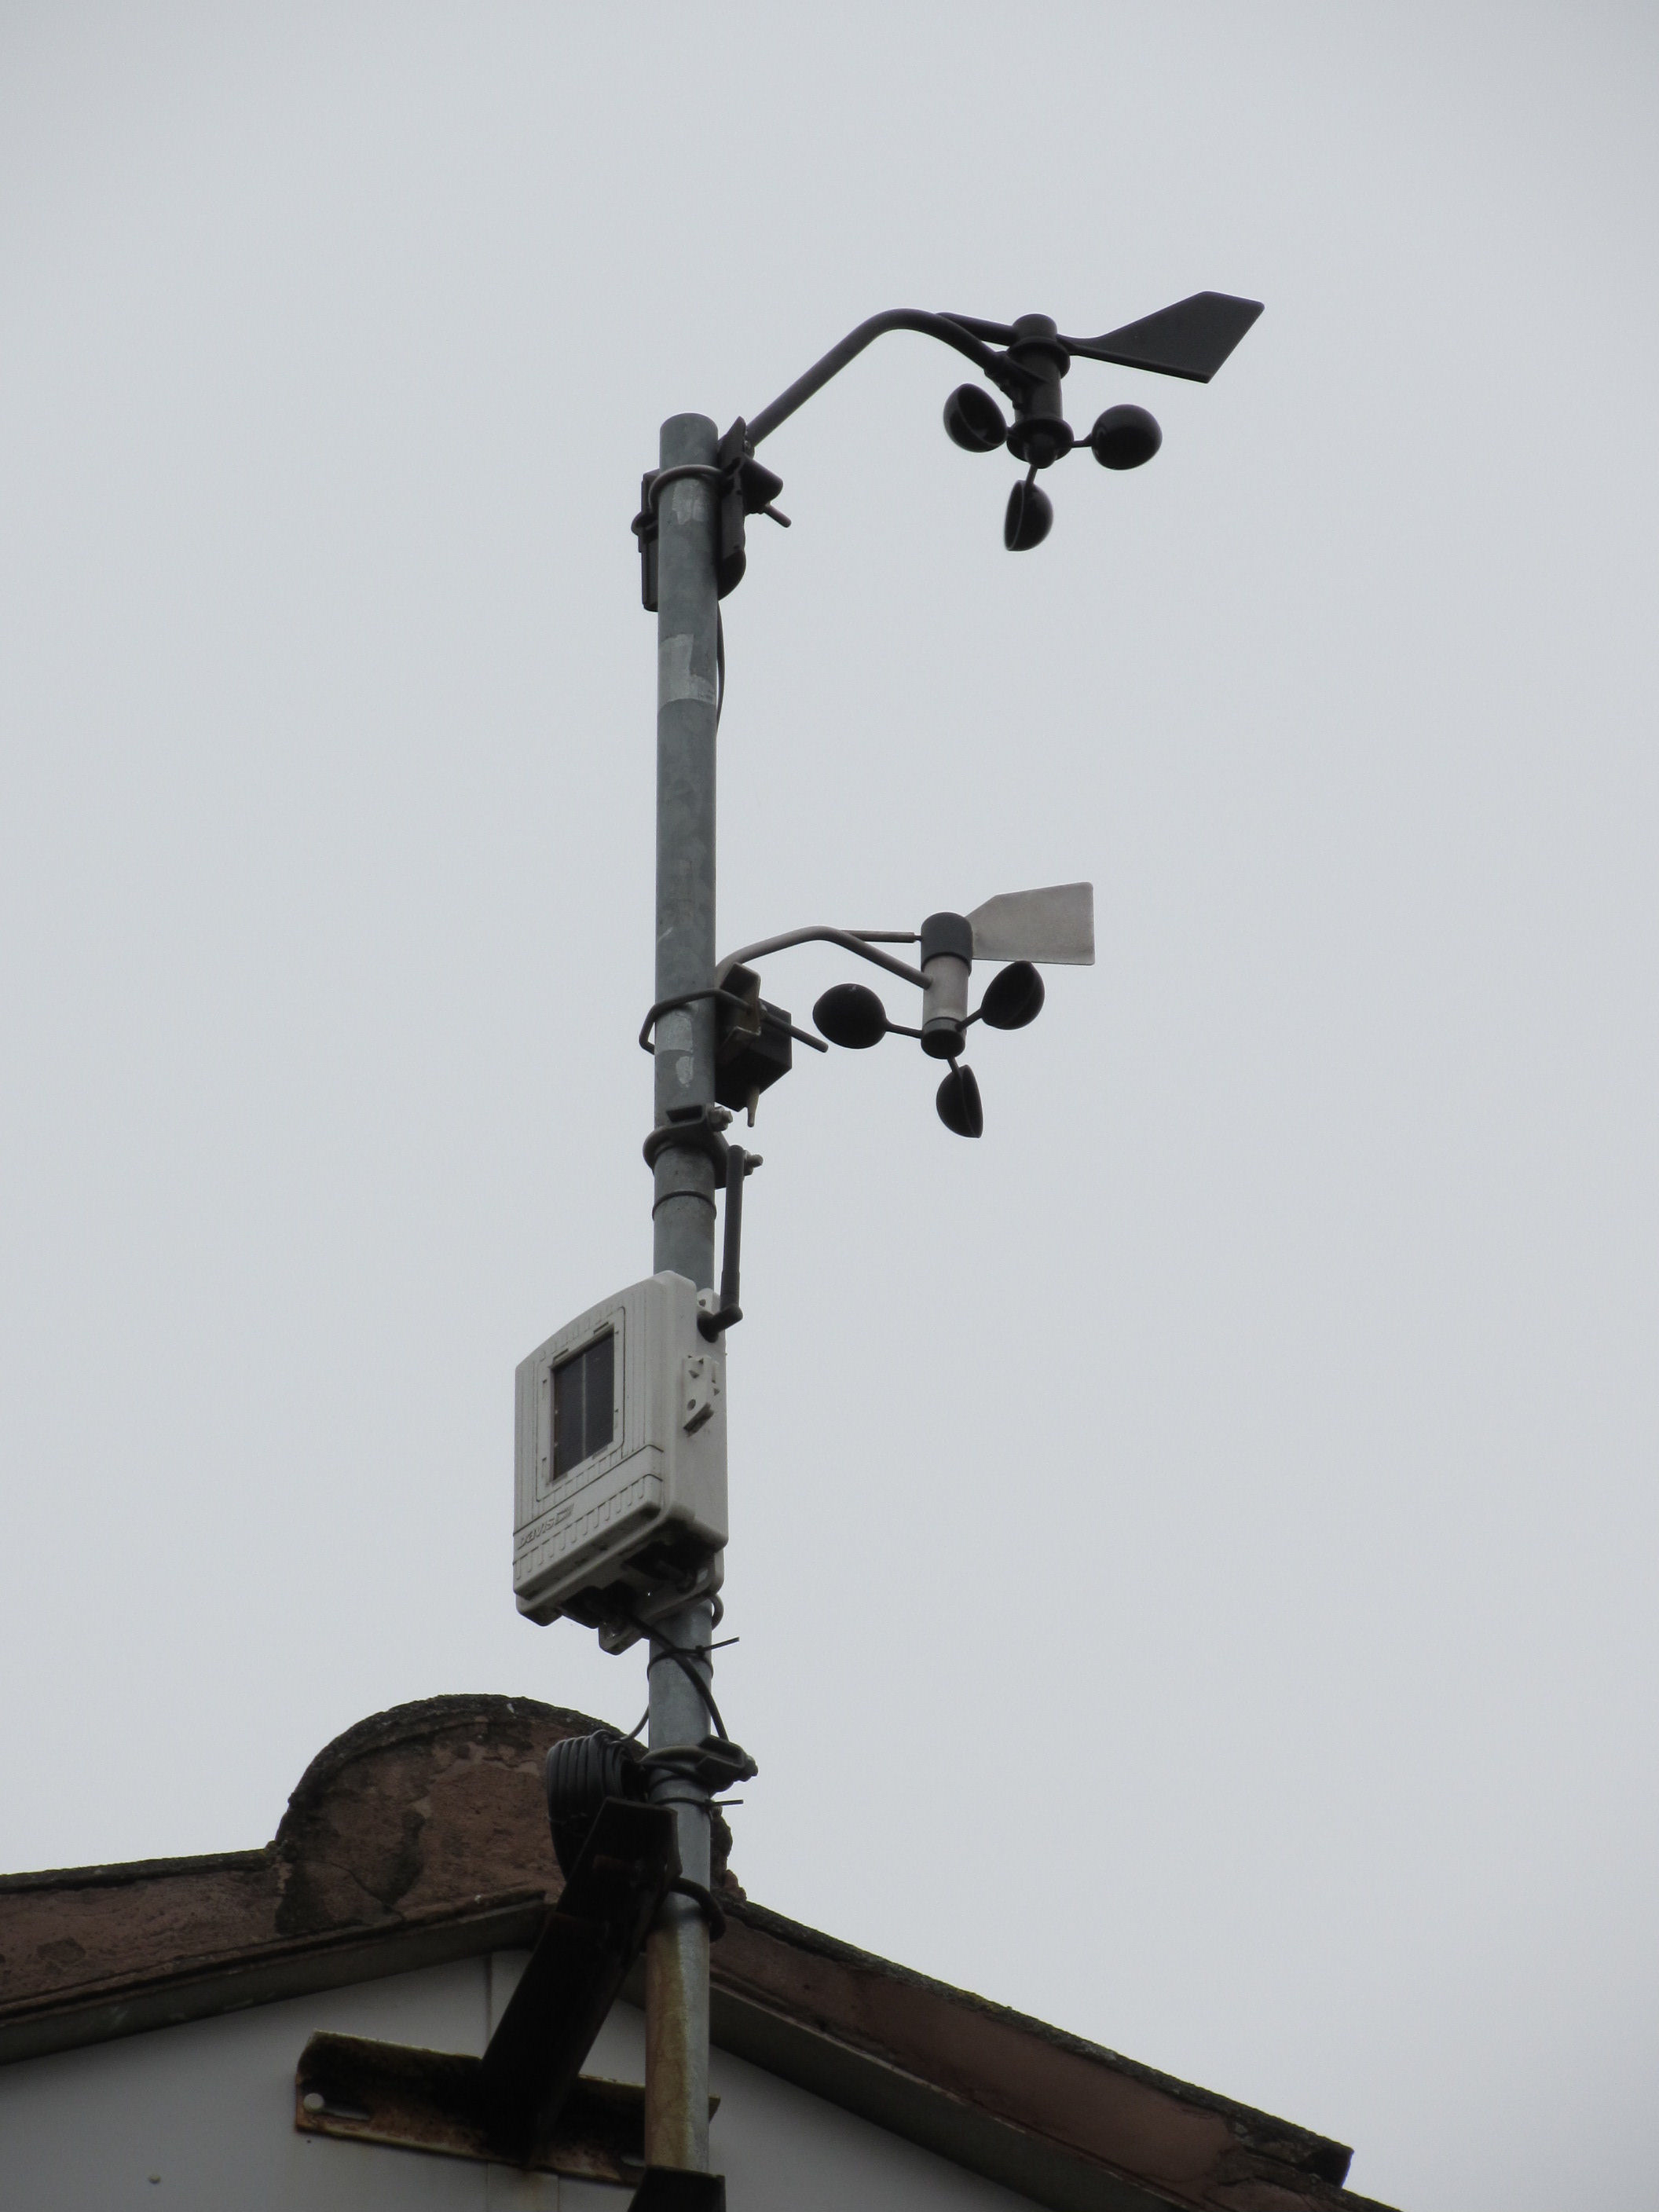
The top section on this mast is the wind part of the Davis Vantage Pro2. It too is wireless and solar powered. It has been placed on a mast on the highest part of the roof. Although it should ideally be higher, this is the best possible on this site. It is situated at an approximate height of 6 metres. The lower anemometer belongs to the Instromet apparatus that can be seen on the More About ICT page. It's data is displayed on the sitting room mantelpiece. |
Your Weather Spreadsheets
One of the best ways to see what sort of weather you have had is to enter the data into a spreadsheet. The graphs show when the temperature has gone up and down. It is easy to see when there was the most rain. Each weather measurement is easier to evaluate. Depending on which measurements you take each day, there are three different empty spreadsheets for you to choose from on the right.
If you are just reading the current temperature and the rainfall, you will need the basic spreadsheet.
If you are taking more readings, look at the intermediate and the complex spreadsheet and choose which is best for you.
You don't have to fill in all of the boxes. You can do what is best for you.
When you are ready load up the empty spreadsheet. Save it using different names for the months and years that you aim to record. Load up the one you need and start typing in the data. There is no need to set anything up, it is all ready for you to use. Below are some of the helpful graphs which the spreadsheets can automatically draw for you.
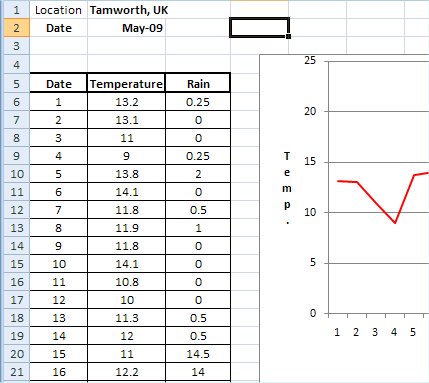
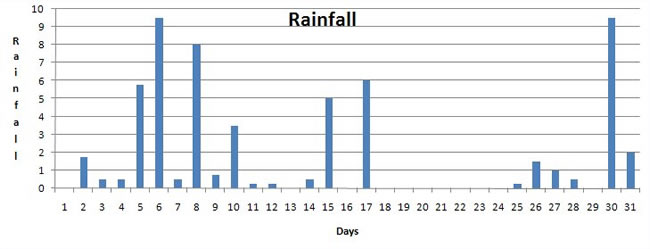
Rainfall Graph |
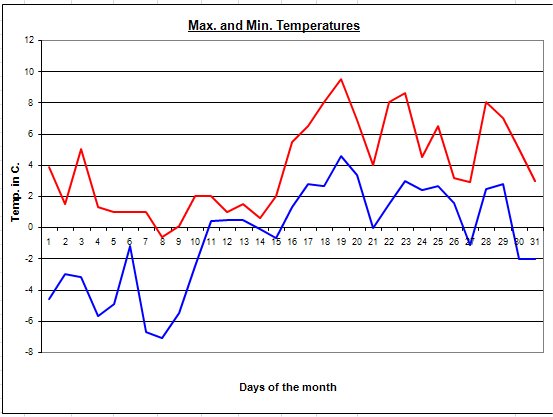
Maximum & Minimum Graph |
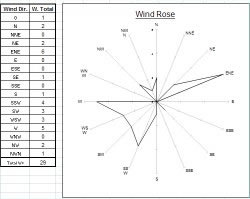
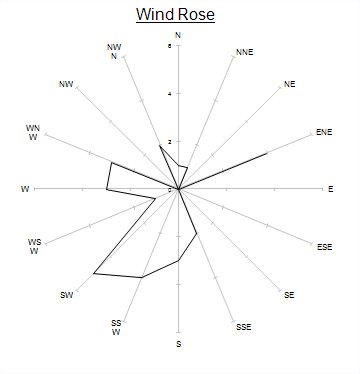
Wind Direction Chart |
This rainfall graph appears in all of the levels of spreadsheet (basic, intermediate and complex). It means you can quickly see which months have been the wettest. When you type data into any of the spreadsheets, if there is a graph linked to the cell, the graph will be drawn automatically. This is already set up in the blank files. The bar chart fits in well with this data. A line graph would not be suitable for rainfall. |
This maximum and minimum temperature graph is very important. You can check that the minimum is not more than the maximum, or the maximum less than the minimum. This would not make sense. It is a good way to error check both your thermometer readings and your data entry. This graph is in the intermediate and complex spreadsheets. |
This is a very attractive graph. You will be able to see which wind direction is prevalent. This might help you know what weather is most commonly brought to you by the wind. Where is most of the wind coming from, land, sea, the north? This chart has the eight points of the compass in the intermediate spreadsheet, and sixteen points in the complex spreadsheet. |
 |
 |
 |
Explanation of features on the data chart
Date - This is recorded in the first column. This is the date of the reading. The climatological day runs from 09.00 to 09.00 GMT.
Max. T. - The highest temperature for the last 24 hours. (This is more likely to be on the previous day, particularly in the summer. However in some cases this will not be so.)
Min. T. - The lowest temperature for the last 24 hours. (This may more often be on the morning of the day of the recording. However there are cases when it will be on the previous day.)
Dry T. - The dry temperature.
Wet T. - The wet temperature.
Hum. - The humidity calculated from the dry and wet temperatures.
Press. - The air pressure reading in mB.
Wind D. - The wind direction.
Wind St. - The wind strength as measured on the Beaufort Scale.
Cl.am. - The amount of cloud cover, measured in Octas.
Cl.Ty. The main types of cloud.
C. Clear of cloud
Ci. Cirrus
Cc. Cirrocumulus
Cs. Cirrostratus
Ac. Altocumulus
As. Altostratus
Ns. Nimbostratus
Sc. Stratocumulus
St. Stratus
Cu. Cumulus
Cb. Cumulonimbus
Rain - The amount of rain collected in a rain gauge for the past 24 hours. This
is measured in mm. (T = total rainfall)
Snow - The height of snow, measured in cm.
Ave. - This is the average.
Max. - This is the maximum.
Min. - This is the minimum.