Weather Round the World
Work on weather round the world is relevant to children at any age. These activities can be easily adapted to suit younger or older pupils. There are supporting files to go with the resources. The activities will be added to in the near future.
Collecting Weather DataRunning a weather station and keeping a record of the weather is both educational and interesting. This website will be useful to see what Basic Apparatus you will need, learn how to make a Weather Box and to learn more about Setting Up. |
||||||||||||||||||||||||||||||||||||||||||||||||
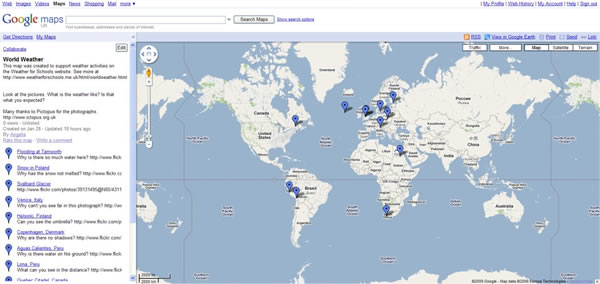
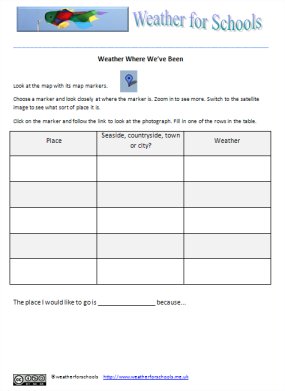
Create a multimedia resource for children to exploreLooking at photographs is a great way to find out about the weather. If these photographs are linked to a map it is even better. This activity will enable the educator to produce an online map to share without the need for special programs. All you will need are some photographs of different places, if possible selected for the evidence of the weather shown on it. You will also need access to the internet. Objectives - Method - Show the prepared map to the children. Explain that they are going to try and find out what the weather is like in different places. Try out a couple of photographs. Discuss what each tells us about the weather on that day, in that location. For some ideas about how the children can be taught to extract weather information from photographs see the Photographs and the Weather guidance sheet. Look at the location on the map. Is it near the equator? Is it near the poles? Is it somewhere in between. Zoom in to see if the place is coastal. Switch to satellite view to see if it is countryside or town. Explain to the children how they are going to record their work. Show them the World Weather Worksheet. Explain what you want them to achieve. If you are differentiating in any way explain this. Set the children to work exploring the map and filling in the worksheet. In a subsequent lesson you may want the children to fill in the places they investigate on an outline map of the world. See the links section for a good outline map. Before they complete this task, work together to locate a couple of places from the multimedia map onto the outline map. Point out how to match the shapes of the countries even though they are different sizes on the two maps. Explain which parts are sea and which are land. Use the points of the compass to describe the locations. |
||||||||||||||||||||||||||||||||||||||||||||||||
Developing this idea - |
||||||||||||||||||||||||||||||||||||||||||||||||
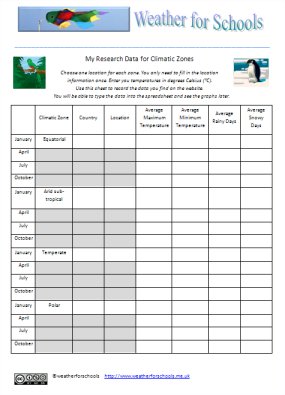
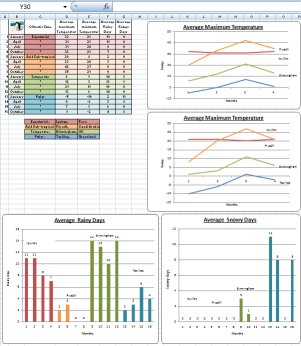
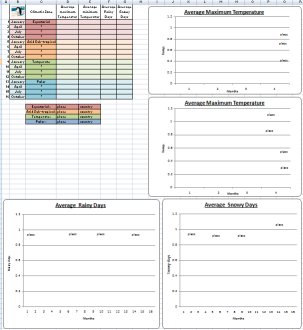
Climatic ZonesIt is interesting to find some average weather data for somewhere in each climatic zone. The use of average data is important if the climate is going to be researched rather than the weather. Looking at the year's averages for temperature and rainfall will also show whether the location has seasons. This data can then be graphed so that it is easy to compare. Objectives Method
(IMPORTANT - click on 'centigrade' on every data page to see the degrees Celsius.) Explain to the children that they need to enter the number just as they are, with the decimal point. Show them how to use the full stop for the decimal point. (Reassure them that the decimal places are just fractions - less than one.) Enter the details of the location and the weather data in the table on the Climatic Zone Data Sheet. You could just enter the data from one month, or you could fill in data for the four seasons. You will then be able to see if this location does have seasons. If it is more practical split the zones between different groups, they can then share their data. To finish off this work, graph the data and see what it shows. Compare what the data shows to the descriptions of the climatic zones. Do they match? Graphing the data with pencils and crayons would be great, but you can also use a spreadsheet. Both methods support mathematics work well. An example spreadsheet, and a blank spreadsheet are included in the resources on the right. Load them into MS Excel, edit the place names (on the graphs you just click in the text box and edit), then as the data is entered the graphs will draw themselves. Hopefully the children will notice warmer/colder, wetter/drier, clear seasons/no clear seasons and snow/no snow. Remind them that the data they have used has been collected over many years to give these averages. That means that they are looking at climate rather than weather. |
||||||||||||||||||||||||||||||||||||||||||||||||
Using maps...Whenever you use a map with children take a little time to get over an extra mapping teaching point. In this instance you could remind the children that because the world is a sphere, when the land is represented on a flat surface the shapes will not be accurate. Although the link on the right may be a practical representation to use, occasionally show other ways of representing land and sea. A traditional atlas or geography text book is still an essential tool, and will contain helpful pages. Also look at real globes and Google Earth to see the earth in its true form. |