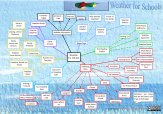
Collecting Weather Data
Have you set up your weather station correctly? Perhaps you would like to check
by looking at Setting up your Weather Station.
Reading scientific instruments can be quite difficult. Look at the
hints on the various pages to help you to be accurate.Use the links
in the text or the page links on the right. Don't forget that these
skills will help you in Mathematics, Science, Geography
and your everyday life!
If you can record the weather every day, over a long time, you will be able to find out more about your location's weather. Once you get into the swing of collecting data, you may carry on for many years.
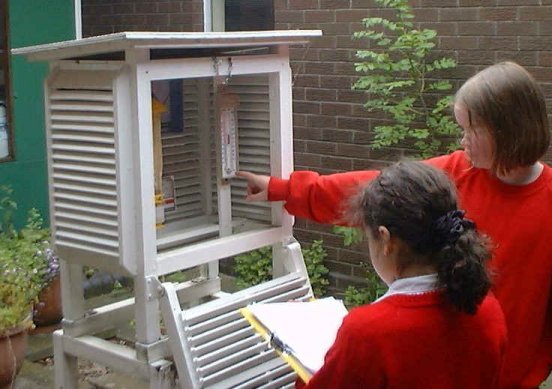
When to Collect your DataWeather data needs to be collected at around about nine o'clock GMT (Greenwich Mean Time). This is important to make your data comparable with other sites' data. It would be ideal to collect data on Saturdays and Sundays, but if this is not possible it cannot be helped. At one school, weekend and holiday weather data is supplemented by a keen amateur weather watcher. If you have automatic equipment this problem can easily be remedied. |
 |
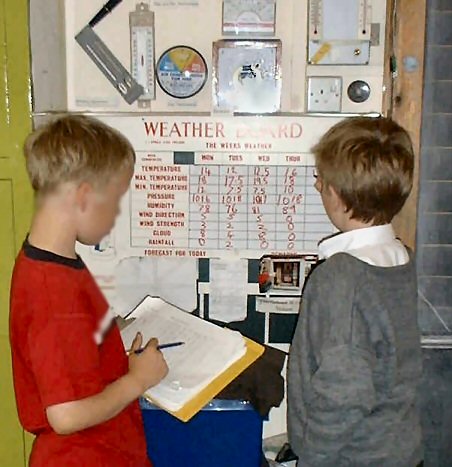
Data Collection SheetThe data needs to be filled in on a standard raw data sheet. One sheet is used for each month. This can then be checked and typed into a spreadsheet document at the end of the month. It is fun to display the data for the rest of the school. Put it on a special blackboard or simply pin up a data sheet. See a raw data sheet and instructions on the right. |
 |
Recording Maximum Temperature and 'throw back'When manual readings are taken at 09.00 GMT (or local 09.00) the maximum temperature will most likely have happened on the previous day. This would be when it was warmest. For this reason this reading is entered for the previous day. This is known as 'thrown back' data. For example when a maximum temperature of 14 is observed at 09.00 on Tuesday it is recorded as the maximum temperature for Monday. This is because it is unlikely that by 09.00 the temperature will have exceeded yesterday's maximum temperature. It is important to do this so that your data can be compared with that of other stations. |
Recording RainfallThe same happens with rainfall. If you only empty the rain gauge once a day at 09.00 you may not know when the rain fell. It is more likely to be before midnight than after. This is because only nine of the 24 hours will have happened on the day of recording. So as with the maximum temperature the reading is entered for the previous day. The data is 'thrown back.' This may be one of those instances when automated weather stations have a clear advantage.
|
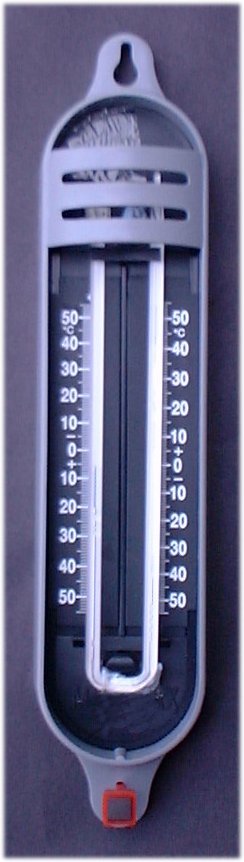
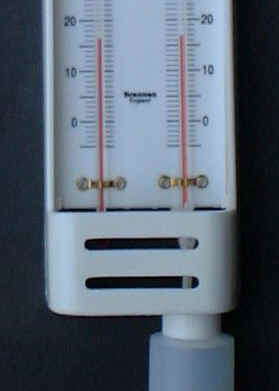
Reading TemperaturesGo to the temperature page to see instructions on how to read thermometers. This image shows a maximum and minimum thermometer. |
 |
Working out the HumidityOn the humidity page you will learn to measure the moisture in the air. The image shows the dry and wet bulbs which can be used for this task. |
 |
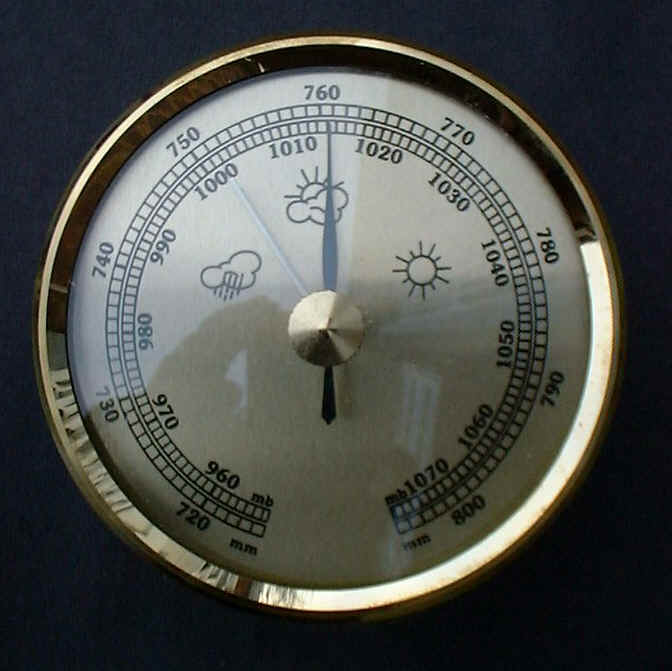
Air PressureYou will find out on the air pressure page how to read an air pressure instrument called a barometer. A barometer can be seen on the right. |
 |
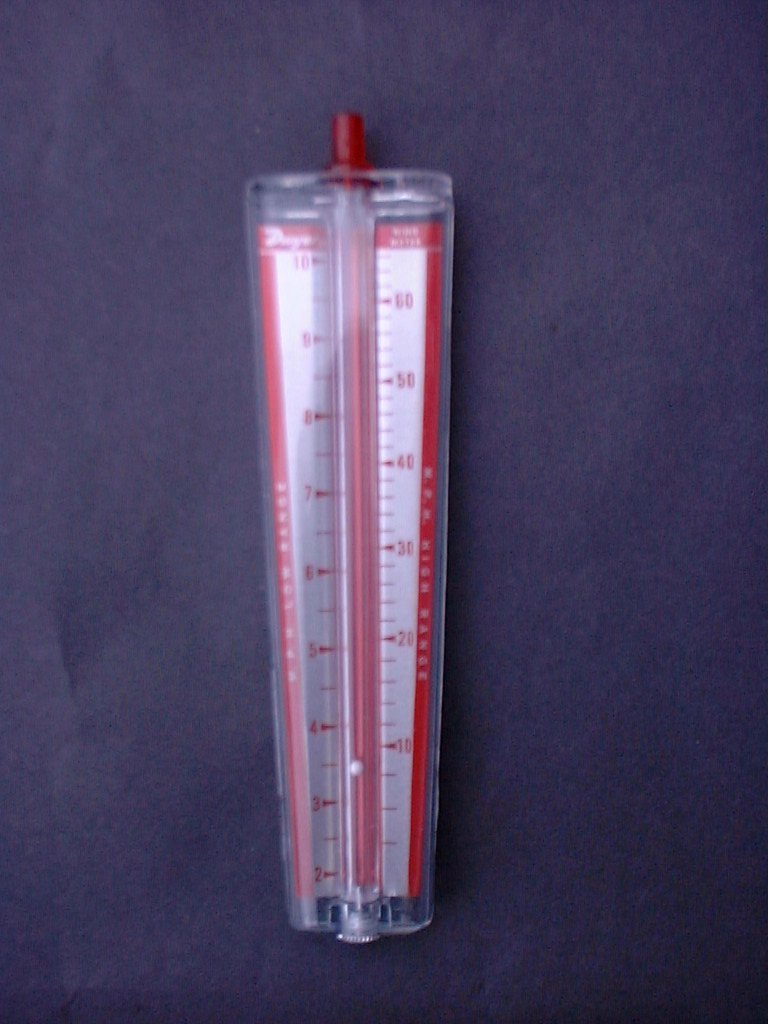
Wind MeasurementsThe wind measurement page has details about the different wind strengths and the significance of wind direction. The image on the right is just one type of instrument for measuring wind strength. |
 |
Recording Cloud DataOn the cloud page learn cloud names and how to record the amount of cloud in the sky. When you know how to identify clouds you will be amazed how many different types you see! |
 |
SunshineThe sun is the power that makes all of the weather. If you think about any sort
of weather you will find that the sun is there making it all
happen. Changes in air pressure are caused by the heating of
different parts of the globe to different temperatures. The differences
in air pressure cause the winds. Read more on the sunshine page. |
[Sound is only water spraying and bird song] |
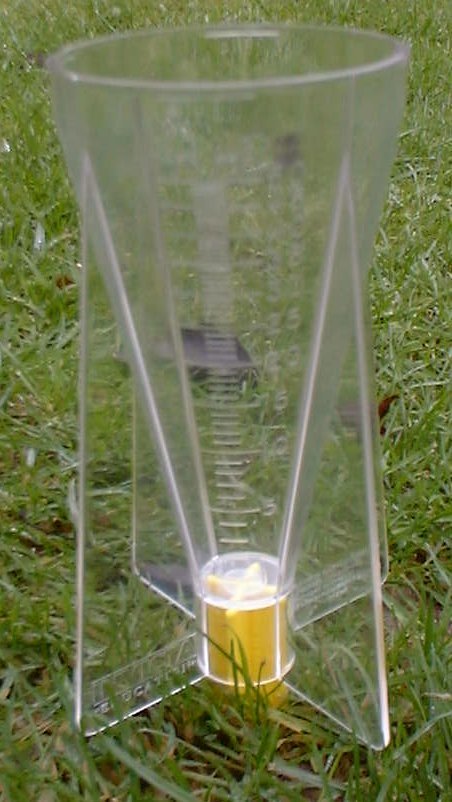
Measuring PrecipitationThe precipitation page will show how the daily rainfall can be accurately measured. Where you put your rain gauge and the units you use as measurements are both important. It also explains about the other forms of precipitation. The rain gauge in the photograph is just one sort that can be easily purchased. |
 |
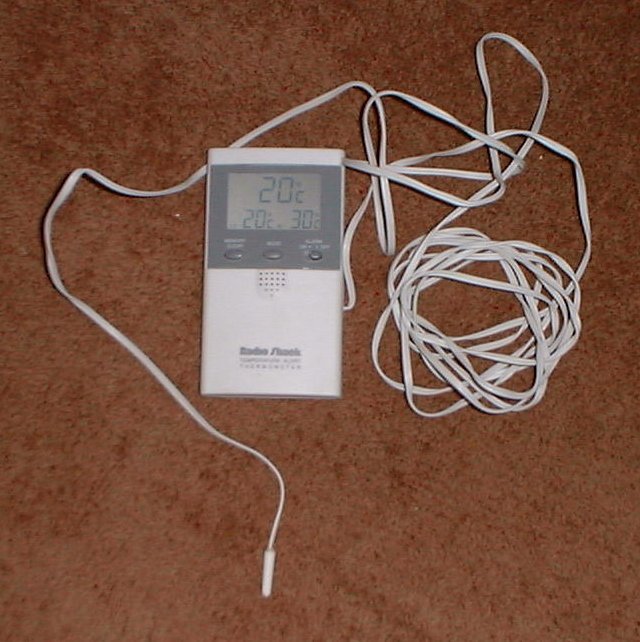
Using ICTNot everybody can use ICT to help them with their data collection. There are, however, lots of devices which could be interesting to use. Go to the ICT page if you would like to see some of them. You may have some of these things at school. The instrument in the image can measure the current, maximum and minimum temperatures in two locations. |
 |